





Resilience on the Blockchain: Bitcoin and Ether Mount Sudden Comeback as Cryptocurrencies Carve a Path Distinct from TradFi
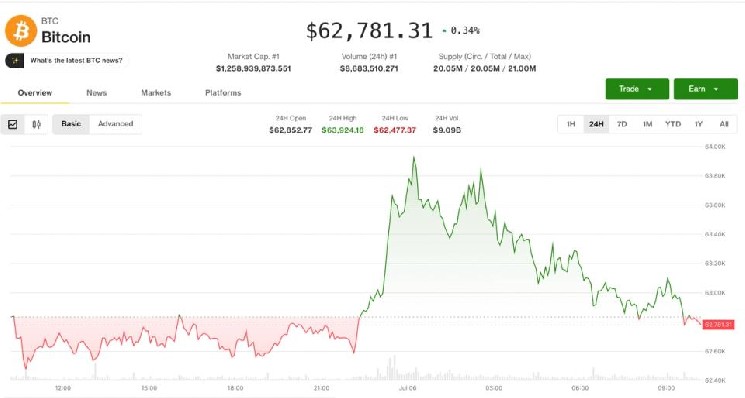
The digital asset ecosystem has mounted a defiance of bearish forecasts, staging a sharp and much-needed rally to start the week. Bitcoin ($BTC) reclaimed the critical $62,800 threshold on Monday, marking a dramatic reversal from its July 1 nadir when it slipped below $58,000—its lowest valuation since September 2024. That dip had sent a shockwave of anxiety through the trading community, fueling widespread speculation of a deeper capitulation toward the $50,000 liquidity pocket.
Concurrently, Ether ($ETH) followed a near-identical trajectory of recovery, ascending to $1,760 after plumbing local depths around the $1,550 zone just last week. This synchronized resurgence saw both premier cryptocurrencies spike sharply higher during Sunday’s global futures market open. Although profit-taking chipped away roughly 1% of those gains in the hours following midnight UTC, the broader rebound suggests that institutional and retail buyers stepped in aggressively to absorb the sell pressure at major technical support levels.
Market Recovery Snapshot:
┌─────────────────┬───────────────────┬───────────────────┐
│ Asset │ Weekly Low │ Monday Price │
├─────────────────┼───────────────────┼───────────────────┤
│ Bitcoin (BTC) │ < $58,000 │ $62,800 │
│ Ether (ETH) │ $1,550 │ $1,760 │
└─────────────────┴───────────────────┴───────────────────┘
Interestingly, this minor intra-day pullback in digital assets represents a clear divergence from traditional financial markets. Wall Street kicked off the post-holiday trading week in high spirits, with technology-heavy Nasdaq 100 index futures climbing 1% and the broader S&P 500 index futures rising 0.5% after the extended U.S. holiday weekend.
Historically, highly speculative assets like cryptocurrencies trade in tight correlation with macroeconomic risk-on assets like tech equities. However, this temporary decoupling underscores a market finding its own footing, driven by localized liquidity shifts, regulatory adjustments, and digital-native derivatives positioning rather than macroeconomic headlines alone.
The Altcoin Spectrum: Winners, Losers, and the Momentum Behind Lighter ($LIT)
Within the wider alternative cryptocurrency sector, performance remains highly fragmented, painting a picture of selective capital allocation rather than a tide that lifts all boats. Lighter ($LIT), the native utility token of the eponymous high-performance decentralized order-book exchange, has emerged as the undisputed standard-bearer of this cycle’s market structure. The token extended its blistering rally on Monday, tacking on an additional 5% since midnight UTC to post a whopping 13.5% gain in 24 hours. Over the trailing seven-day period, $LIT has surged by more than 50%.
This relentless upward momentum stems from a fundamental overhaul of the project’s tokenomics, which has incentivized long-term holding and attracted yield-seeking traders looking to capitalize on the next prospective hyper-liquid decentralized finance (DeFi) boom. According to decentralized application tracker DefiLlama, Lighter’s underlying decentralized derivatives platform has facilitated an eye-watering $40 billion in trading volume over the last 30 days alone, proving that speculative interest in the utility token is backed by real, fee-generating transaction volume on the blockchain.
Altcoin Performance Dispersion (24-Hour Trends):
──────────────────────────────────────────────────────────
▲ Lighter (LIT): +13.5% (Driven by tokenomics overhaul)
▲ Pyth (PYTH): +6.0% (Speculative capital rotation)
▼ Cardano (ADA): -4.0% (Consolidation and profit-taking)
▼ Morpho (MORPHO): -4.0% (Decline amid selling pressure)
──────────────────────────────────────────────────────────
This pockets-of-strength narrative is further illustrated by Pyth Network (PYTH), the decentralized oracle platform, which registered a robust 6% bump on Monday morning. Market analysts attribute this performance to classic capital rotation, a phenomenon where traders harvest profits from successful Bitcoin trades and distribute those gains into high-beta, infrastructure-focused altcoins.
Conversely, the rally is far from universal. Not established layer-1 chains or legacy tokens shared the positive sentiment; Cardano ($ADA) and Morpho ($MORPHO) both nursed losses of roughly 4% over the same 24-hour window. This stark divide reveals a sophisticated, discerning investor class that is no longer buying the market en masse, but rather picking winners based on protocol usage, active development, and robust community engagement.
Exploring the Derivatives Landscape: Leverage Remains Quietly Stretched Under the Surface
A deeper look into the plumbing of the cryptocurrency derivatives market reveals a state of watchful waiting, with leverage remaining stable yet highly concentrated. Open interest—the total value of outstanding derivative contracts that have not been settled—for Bitcoin ($BTC), Ether ($ETH), Solana ($SOL), and Ripple ($XRP) remained largely flat. This consolidation is likely a byproduct of the extended U.S. holiday weekend, which typically temporarily drains institutional liquidity and desks from active trading.
Nevertheless, subtle undertones of speculation are bubbling beneath this calm facade. Open interest in Litecoin ($LTC) suddenly swelled to 7.14 million tokens, marking its highest level of derivatives market commitment since mid-May. However, assessing whether this sudden influx of capital is decidedly bullish or bearish is a complex task, as key market health indicators are throwing off highly polarized, contradictory signals.
Litecoin ($LTC) Derivatives Indicators:
┌───────────────────────────┬────────────────────────────────────────┐
│ Indicator │ Market Implication │
├───────────────────────────┼────────────────────────────────────────┤
│ Funding Rates (Positive) │ Bullish: Long positions paying shorts │
│ Cumulative Delta (CVD) │ Bearish: Sellers hitting market bids │
└───────────────────────────┴────────────────────────────────────────┘
On one hand, positive funding rates across major derivatives venues suggest that traders holding long positions are willing to pay a premium to maintain their leverage, hinting at underlying optimism. On the other hand, the 24-hour cumulative volume delta (CVD)—which measures the net difference between buying and selling pressure—has sharply turned negative.
This indicates that aggressive sellers have been actively hitting market bids rather than placing passive limit orders on order books, pointing to a persistent distributed sell-off. Similarly, interest in Lighter’s ($LIT) derivative products hit a one-month high, aligning with the spot market’s enthusiasm and demonstrating that traders are eager to leverage the asset’s structural price discovery phase.
Volatility Indices Retrace as Options Sellers Maintain the Upper Hand
Implied volatility, often referred to as the marketplace’s “fear gauge,” has continued its post-drawdown contraction. Bitcoin’s and Ether’s respective 30-day implied volatility indices, BVIV and EVIV, are hovering near multi-week lows following consecutive double-digit declines. This contraction points directly to a steady, relentless supply of options being written (sold) by institutional yield-harvesting funds.
When options writing eclipses options buying, it signals a collective market expectation of range-bound trade or slow, grinding upward consolidation. This environment is historically conducive to price recovery, as quiet, less volatile markets allow spot buyers to accumulate positions without triggering massive cascades of leveraged liquidations.
Options Open Interest Concentration (Strike Prices):
┌───────────────────────────┬───────────────────────────┐
│ Bearish Protection │ Bullish Targets │
├───────────────────────────┼───────────────────────────┤
│ $60,000 BTC Puts │ $70,000 BTC Calls │
└───────────────────────────┴───────────────────────────┘
Despite the volatility dampening, options desks on Deribit—the world’s leading cryptocurrency options exchange—reveal that professional market participants are still unwilling to completely drop their defense. Puts (downside protection) continue to trade at a premium relative to calls (upside exposure), showing that a bias toward downside hedging remains firmly entrenched.
Even though this premium gap has narrowed considerably since its widest point early last month, the structural demand for downside security illustrates a market that is climbing a notorious “wall of worry.” Traders are participating in the rally but remain highly sensitized to potential downside risks. This defensive posture is further validated by recent trading volumes, which show a strong concentration of open interest around both the $60,000 put option strike and the $70,000 call option strike. This suggests that market participants expect Bitcoin’s medium-term path to be resolved within this broad trading corridor.
Altcoin Season or Selective Speculation? Decoding the Lagging Metrics
As speculative appetites creep back into the digital asset ecosystem, CoinMarketCap’s Altcoin Season Index climbed to 52 out of 100 on Monday. This reading marks the highest metric registered by the index in three months, technically signaling a shift out of a regime completely dominated by Bitcoin and toward a more fertile playing field for alternative layer-1s, utility protocols, and scaling networks.
However, professional analysts warn that this metric may be a lagging indicator that fails to capture the true dispersion of performance across the board. While specific high-profile protocols like Lighter ($LIT) and Pyth Network ($PYTH) steal the headlines with double-digit moves, a significant portion of the mid-and-small-cap market continues to struggle.
Lagging Performance Dragging Down the Broad Market:
┌─────────────────┬───────────────────┐
│ Asset │ Weekly Drawdown │
├─────────────────┼───────────────────┤
│ Jito (JITO) │ -5.0% to -13.0% │
│ Beat (BEAT) │ -5.0% to -13.0% │
│ Stable (STABLE) │ -5.0% to -13.0% │
└─────────────────┴───────────────────┘
A prime example of this performance drag is visible in assets like Jito ($JITO), Beat ($BEAT), and Stable ($STABLE), which have experienced weekly drawdowns ranging between 5% and 13%. These assets faced further sell pressure on Monday morning even as Bitcoin and Ether rallied.
This stark divergence suggests that the “Altcoin Season” label might be a bit of a misnomer in the current cycle. Instead of a broad capital rotatory wave into all alternative digital assets, the market is experiencing concentrated cycles of speculation. Investors are focusing their attention on projects with demonstrable revenue generation, real-world utility, or compelling narrative structures, leaving Zombie networks and overvalued tokens behind.
Navigating the Road Ahead: What Lies Beyond the Trading Range?
As the cryptocurrency market settles into its new, higher trading range, the road ahead is likely to be characterized by heightened sensitivity to liquidity indicators and macroeconomic policy. The market’s resilience in the face of the sub-$58,000 dip has successfully liquidated over-leveraged late shorts, laying a cleaner foundation for potential gains.
However, for a sustainable push back toward the all-time highs of $73,000 for Bitcoin and $4,000 for Ether, the spot market will need to see consistent, sustained inflows from U.S.-listed spot ETFs. This institutional demand must also be supported by a broader return of global retail participation.
Macroeconomic and On-Chain Factors to Watch:
┌───────────────────────────┬────────────────────────────────────────┐
│ Catalyst │ Potential Impact │
├───────────────────────────┼────────────────────────────────────────┤
│ Spot ETF Inflows │ Necessary to sustain BTC/ETH rally │
│ Volatility Coiling │ Implies a breakout is brewing │
│ Altcoin Selection │ High utility projects to lead trend │
└───────────────────────────┴────────────────────────────────────────┘
For now, the digital asset class is navigating its own path, shaking off temporary macro-economic correlations to focus on internal structural strength. The contraction in implied volatility suggests that a major breakout or breakdown is brewing behind the scenes, as quiet markets historically act as springboards for explosive moves.
Whether the market breaks to the upside depends on the key $60,000 and $70,000 zones. Until these boundaries are clearly broken, the prevailing narrative remains one of selective speculation, where astute risk management and precise project selection remain the key to finding opportunity in a highly fragmented market.