






Bitcoin’s Historic Calm Before the Storm: Volatility Squeeze Sets Stage for Major Price Swing
By [Staff Correspondent] | Markets & Crypto
The cryptocurrency market is currently witnessing an anomaly that has traders and analysts on high alert. In recent weeks, Bitcoin’s price action has become eerily tranquil, with volatility compressing to levels not seen in nearly a decade. While such quietude might suggest stability to the casual observer, on-chain researchers are warning that this specific pattern of “market squeeze” has historically been the precursor to explosive, headline-grabbing price movements within a matter of weeks.
According to data shared by Sherlock, a prominent DeFi researcher, the current contraction in Bitcoin’s trading range is not just unusual—it is statistically monumental. By measuring the 14-day trading range, Sherlock’s analysis reveals that the current volatility is narrower than 99.5% of all historical data points. This puts the market in an incredibly rare position, one that has occurred only a handful of times in Bitcoin’s history. The significance of this compression is rooted in the physics of markets: when energy is constrained in a tight box, the eventual breakout is usually violent.
The Historical Precedent: A History of Explosive Breakouts
To understand what might lie ahead, we must look backward. Sherlock’s deep dive into the historical data identified 19 independent periods since Bitcoin’s inception where volatility was squeezed to similarly extreme lows. The findings from these episodes are remarkably consistent and suggest that the current calm is unsustainable. In 100% of these identified instances, the price of Bitcoin moved by at least 12.5% within the 45 days following the initial observation of the squeeze.
This is not a case of a coin flip leading to a minor adjustment; the data points to significant directional movement. The median maximum price movement observed across these historical examples was a robust 21.5%, while the average maximum movement reached an even more impressive 27.9%. For a market the size of Bitcoin’s, a swing of this magnitude represents a substantial shift in investor sentiment and portfolio valuation, often triggered by a cascade of leveraged liquidations once a key resistance or support level is breached.
The Timeline: Why August 30th is a Date to Watch
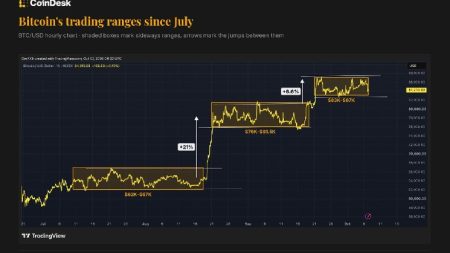
According to Sherlock, the current squeeze began on or around July 16th, a date when Bitcoin was trading at approximately $63,830. If historical trends are to repeat themselves, we are rapidly approaching a critical inflection point. The researcher posits that if the pattern holds, Bitcoin could realistically reach either $71,809 or $55,851 by August 30th. This specific projection is based on the 12.5% minimum movement threshold that has been observed in every previous historical instance of this nature.
The roughly $8,000 price gap between the predicted high and low targets highlights the binary nature of the upcoming move. A break above the $71,800 level could signal a resumption of the broader bull market, attracting fresh capital from institutional players who have been waiting for a confirmed breakout. Conversely, a rejection that drives the price down to the $55,800 range would likely confirm a deeper correction, potentially triggering a bout of panic selling among retail investors who entered the market at higher price points.
The Critical Question of Direction: A 50/50 Race
However, despite the high probability of a significant move, the data offers a stark warning to those attempting to predict the side. Sherlock cautioned that while the volatility squeeze increases the likelihood of a strong price move, it provides no clear statistical advantage in forecasting the direction. Of the 19 consolidation periods analyzed in the past, the initial breakout was bullish (upwards) in 9 instances, and bearish (downwards) in the remaining 10.
This symmetry suggests that the market is at a true crossroads, where the outcome will depend more on external macro-economic pressures—such as Federal Reserve policy decisions, inflation data, or geopolitical events—than on the technical setup of the chart itself. This nuance is crucial for risk management; investors who attempt to leverage this signal without a stop-loss could face catastrophic losses if the coin flips against their position.
Market Implications and Trader Sentiment
The identification of this volatility squeeze comes at a time when the broader crypto ecosystem is facing headwinds from global regulatory scrutiny. The inability to predict the exact direction forces traders to adopt more flexible strategies. Many are likely to wait for the “second leg” of the move, where after the initial price burst, a retracement often occurs—providing a safer entry point.
The current confluence of low funding rates, quiet spot markets, and compressed Bollinger Bands often signals a decrease in market-making activity. However, Sherlock’s analysis serves as a reminder that this calm is the “quiet before the storm.” For derivatives traders, the upcoming 45-day window is critical; the next consumer price index report or major economic announcement could serve as the catalyst that ignites the moves hinted at by the volatility data.
Conclusion: Prepare for Volatility
In conclusion, while the immediate future of Bitcoin’s price remains uncertain, the statistical probability of a significant move within the next month is virtually certain. The current volatility squeeze is a massive warning sign that the market is coiling up for a breakout, even if the direction remains ambiguous. Whether Bitcoin ascends to new yearly highs or plunges below the $56,000 support zone, one thing is clear: the period of inactivity is nearing its end.
Investors would be wise to heed this historical trend. While the warning itself carries a disclaimer that it is not investment advice, the data serves as a critical reminder of the inherent risk and volatility present in the cryptocurrency market. In the world of digital assets, the most predictable thing is unpredictability, and the next 45 days are likely to prove that axiom true once again.