






Bitcoin Price Pulls Back, but Bullish ‘Stair-Step’ Pattern Remains Intact
Bitcoin Price Slips Wednesday, but the Broader Trend Holds
Bitcoin, the world’s largest cryptocurrency by market capitalization, was trading on the back foot Wednesday, slipping to $84,200 in early U.S. market activity. The digital asset was down more than 2% from the previous day’s level near $86,500, according to CoinDesk data. For traders watching the charts, the move was hardly a shock. After all, Bitcoin has spent the past two weeks locked in a range, and Wednesday’s slide simply pushed it deeper into that familiar territory. The pullback also comes after a period of relative calm, which has historically been a precursor to larger moves in the crypto market. What matters more, analysts say, is what hasn’t changed. The cryptocurrency’s broader trajectory remains decidedly upward, defined by a pattern that has been in place since July. Despite the latest dip, Bitcoin is still trading within the two-week consolidation zone that has kept the market in a holding pattern. More importantly, the pullback has not broken the months-long bullish stair-step trajectory that has taken BTC from the low $60,000s to the mid-$80,000s over the course of the autumn. For long-term investors, this is the kind of price action that has become familiar over the past few months. It is not a sharp reversal, nor a sudden loss of confidence. It is a pause, a breather, a moment of digestion after a powerful run higher. The short-term dip may be unsettling for leveraged traders, but for those who view Bitcoin through a wider lens, Wednesday’s move is little more than a ripple in a much larger wave. The key takeaway is that the structure of the market remains intact. While headlines may focus on the red candles and the intraday losses, the bigger picture tells a story of resilience. Bitcoin has survived far more volatile sessions, and it has done so while building a foundation for the next leg higher. The current pullback, in that context, is not a threat to the bull case. It is part of it.
Understanding the Stair-Step Pattern in Bitcoin Technical Analysis
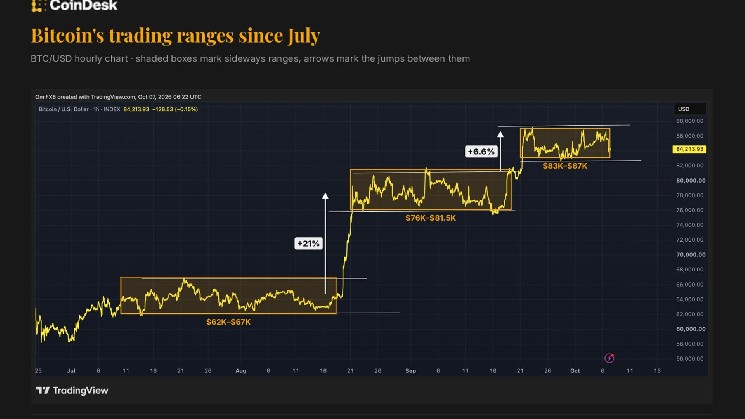
To understand why analysts are not panicking, it helps to understand the stair-step pattern. This is a well-known concept in technical analysis, and Bitcoin has been following it with remarkable consistency since midsummer. The pattern is exactly what it sounds like: a price chart that resembles a staircase, with sharp, sudden rallies followed by extended periods of sideways movement. Each step up is a burst of buying, and each flat section is a period of consolidation where the market catches its breath. In Bitcoin’s case, the stair-step pattern began to emerge in July. Since then, the cryptocurrency has climbed through a series of flat ranges, each one higher than the last. On a chart, the sharp rallies are the climb from one stair to the next. The weeks of sideways trading are the flat steps in between. It is a visual representation of a market that is moving higher, but not in a straight line. Instead, it advances in measured, controlled bursts. The pattern is significant because it reflects a balance between buying pressure and profit-taking. When Bitcoin rallies sharply, some investors cash out, creating a period of consolidation. But rather than reversing lower, the price holds steady, suggesting that new buyers are stepping in to absorb the selling. Once the selling pressure fades, the next rally begins. This creates a staircase of higher highs and higher lows, a hallmark of a healthy uptrend. For technical traders, the stair-step pattern is a bullish signal. It shows that demand is persistent and that dips are being bought. It also provides a clear framework for identifying support and resistance levels. Each flat step becomes a potential support zone, while the highs of each rally become resistance levels to watch. The longer a step lasts, the stronger the support tends to be. That is why Wednesday’s pullback, while notable, has not caused widespread concern. Bitcoin is still sitting on the most recent step, and that step has held firm for two weeks.
Bitcoin Price Action: A Step-by-Step Look at the Recent Rally
The recent price action tells the story clearly. From mid-July to Aug. 18, Bitcoin traded in a relatively tight range between roughly $62,000 and $67,000. It was a period of sideways movement that frustrated momentum traders and tested the patience of long-term holders. Then, in a sudden burst, the cryptocurrency jumped 21% in just three days, breaking out of that range and establishing a new, higher floor. The next step began in late August and lasted until mid-September. During that period, Bitcoin traded between approximately $76,000 and $81,500. Once again, the market consolidated, building a new base. And once again, a sudden rally followed. Between Sept. 19 and Sept. 21, Bitcoin surged 6.6%, pushing the price into its current territory. Since that breakout, Bitcoin has held between roughly $83,000 and $87,000. This is the third step in the staircase, and it is still intact. Wednesday’s decline to $84,200 brings Bitcoin closer to the lower end of that range, but it has not breached it. In fact, the price action is remarkably consistent with the pattern that has played out over the past few months: a sharp move higher, followed by a period of sideways trading, and then another sharp move higher. The consistency of these moves is striking. Each step has been followed by a breakout within days, and the resulting gains have been significant. This is not just a random sequence of price movements; it is a repeatable structure that reflects the underlying supply and demand dynamics in the Bitcoin market. The question now is whether the current step will produce another breakout. If the pattern continues, Bitcoin could be preparing for another sudden rally, potentially pushing it into new all-time-high territory. But patterns are not guarantees. Markets are dynamic, and conditions can change quickly. The stair-step pattern is a useful framework, but it is not a crystal ball. Still, the evidence is compelling. Each step has been higher than the last, and each consolidation phase has led to a breakout. The current range is the highest yet, and it has held despite some notable headwinds. For now, the bulls remain in control.
Crypto Market Analysts See Healthy Pullback in Bitcoin
One of the most notable voices on Wednesday’s price action was Vikram Subburaj, CEO of Giottus, an Indian cryptocurrency exchange. In a comment to CoinDesk, Subburaj offered a clear assessment of the situation: “The October 7 decline does not invalidate Bitcoin’s stair-step rise.” That quote captures the sentiment among many technical analysts who view the current pullback as a normal and even healthy part of a larger uptrend. Short-term declines, in this view, are not necessarily signs of weakness. They are opportunities for the market to reset, to shake out weak hands, and to build a stronger foundation for future gains. As long as Bitcoin remains above its key support levels, the overall structure remains bullish. Subburaj’s comment also reflects a broader shift in how cryptocurrency market participants interpret volatility. In the early days of Bitcoin, sharp pullbacks were often seen as the beginning of a bear market. Now, after years of maturation, analysts are more likely to distinguish between a change in trend and a temporary dip within a trend. The distinction matters. A trend change requires a break of key support levels and a shift in market structure. A dip, on the other hand, is just a dip. The fact that Bitcoin has held its range for two weeks suggests that sellers are not in control. If they were, the price would likely have broken below the lower boundary of the range by now. Instead, Bitcoin has repeatedly bounced off the lower end of its current trading band, reinforcing the idea that buyers are waiting to step in at lower prices. That is not to say the market is without risk. External factors, including macroeconomic conditions, regulatory news, and broader risk sentiment, can always disrupt even the most well-established patterns. But in the absence of such shocks, the technical picture remains one of cautious optimism. The pullback is being watched, but it is not being treated as a warning sign.
Key Bitcoin Support and Resistance Levels to Watch
For traders looking ahead, the focus is squarely on the boundaries of the current range. The lower boundary sits near $83,000, and it has emerged as the most important support level to watch. If Bitcoin were to break decisively below that level, the stair-step pattern could be called into question. A sustained move below $83,000 would open the door to a deeper pullback, with the next potential support zone located in the $76,000 to $81,500 area, the site of the previous step. On the upside, the upper boundary of the current range is near $87,000. A breakout above that level would signal that the consolidation phase is over and that Bitcoin is ready for the next leg higher. Given the pattern’s history, such a breakout could be sharp. The previous two breakouts produced gains of 21% and 6.6%, respectively. If the pattern repeats, a move above $87,000 could quickly carry Bitcoin into new price discovery. But breakouts are not automatic. They require momentum, volume, and a catalyst. The cryptocurrency market is also influenced by broader trends, including the performance of U.S. equity markets, the dollar, and interest rates. A risk-off environment can weigh on digital assets, while a more favorable macro backdrop can help fuel the next rally. The recent price action suggests that the market is coiling. The longer Bitcoin remains inside this range, the more powerful the eventual breakout could be. Trading volume often thins out during consolidation phases, and that can set the stage for an explosive move when the range finally breaks. For now, the range is the story. Bitcoin is neither breaking out nor breaking down. It is simply consolidating, building energy for its next move. Technical analysts will be watching the $83,000 and $87,000 levels closely. A decisive break in either direction would provide a clear signal about the market’s next steps. Until then, the stair-step pattern remains intact. The current range is the highest in the pattern’s history, and it has held for two weeks. That alone is a sign of strength. In a market where volatility is the norm, the ability to hold a tight range after a sharp rally is notable. It suggests that investors are comfortable holding Bitcoin at these levels and that they are not in a hurry to sell.
Bitcoin’s Stair-Step Rise: The Bigger Picture
Stepping back, the bigger picture is one of a market that is still climbing. Bitcoin’s stair-step rise has been one of the defining themes of the current cycle. From the low $60,000s in July to the mid-$80,000s today, the cryptocurrency has made steady, if uneven, progress. Each pullback has been met with buying. Each range has led to a breakout. And each step has been higher than the last. That does not mean the path forward will be smooth. The stair-step pattern, like all technical patterns, can fail. A break below the current range would be a warning sign, and a move below the previous step’s range would be an even more significant red flag. Investors should always be prepared for the possibility that the pattern could break. But for the moment, the evidence points to a market that is in a bullish phase. The consolidation is happening at higher levels, the support levels are holding, and the overall structure remains constructive. Wednesday’s pullback is a reminder that Bitcoin is not a one-way trade. It is a volatile, dynamic asset that requires patience and discipline. For those who have been watching the market over the past few months, the current price action is familiar. It is the same pattern that has played out time and time again: a sharp move higher, a period of consolidation, and then another sharp move higher. The only difference is the price level. The process is the same. In the end, the story of Bitcoin’s stair-step rise is one of resilience. It is a story of a market that continues to attract buyers, even after significant gains. It is a story of a digital asset that has weathered pullbacks, headwinds, and uncertainty, and has come out stronger each time. Wednesday’s decline is just another chapter in that story. The stair-step pattern is still holding, and until it breaks, the bull case remains alive.