


The Gravity of Mathematics: Why Bitcoin’s Drop Below $66,000 Triggers Key Power Law Support
1. The $66,000 Threshold and the Search for Market Equilibrium
The cryptocurrency market once again demonstrated its characteristic volatility as the price of Bitcoin briefly slipped below the crucial $66,000 psychological threshold. This brief correction sent ripples of anxiety through short-term retail portfolios and triggered a cascade of leveraged liquidations across digital asset exchanges. However, beneath the superficial noise of daily price charts, seasoned institutional allocators and quant analysts viewed this localized dip not as a harbinger of a structural bear market, but as a textbook retest of long-term mathematical support. By retreating to these levels, Bitcoin has gravitated toward the absolute floor of its long-term growth channel, a region that has historically separated transient speculative bubbles from periods of deep fundamental accumulation. For market observers who look beyond short-term sentiment, this latest price action serves as a crucial sanity check for an asset class that is increasingly being evaluated through the rigorous lens of quantitative physics rather than mere speculative fervor. The resilience of this boundary during times of broader macroeconomic uncertainty highlights a growing tension within the digital asset space: the clash between erratic leverage-driven derivatives trading and the slow, relentless pressure of spot accumulation by long-term holders.
Bitcoin Price (Log Scale)
^
| # (Top Corridor: Overvalued)
| #
| #
| # <— Historic Peaks
| #
| #
| # <— CURRENT PRICE: Near Bottom Support ($66k Area)
| #
| # <— (Bottom Corridor: Historically Undervalued)
+———————————————————-> Time
2. Unveiling the Mechanics of the Power Law Corridor
To comprehend the structural significance of Bitcoin’s current valuation, one must move past standard moving averages and examine the Power Law model, an analytical framework popularized by physicist Giovanni Santostasi and meticulously refined by the quantitative researchers at Porkopolis Economics. Unlike standard linear financial models that struggle to frame Bitcoin’s astronomical rise from fractions of a cent to tens of thousands of dollars, the Power Law utilizes a double-logarithmic scale to plot price against time. This mathematical approach relies on the premise that Bitcoin’s underlying growth does not follow an exponential curve destined for vertical infinity, but rather behaves like a physical system displaying power-law scale invariance—a phenomenon frequently observed in natural systems such as the organic growth of cities, the branching of river deltas, and the metabolic rates of living organisms. By treating the Bitcoin network as a maturing physical infrastructure characterized by declining marginal volatility and slowing growth over time, the model outlines a remarkably consistent, widening corridor that has successfully mapped the asset’s cyclical peaks and macro troughs for well over a decade. The system suggests that as the network expands and its liquidity deepens, the wild swings of its early years naturally dampen, establishing a predictable, upward-sloping baseline of value that reflects the steady, compounding terminal valuation of global digital scarcity.
3. Decoupling from the Four-Year Halving Myth
This quantitative perspective represents a fundamental departure from traditional, cycle-based valuation models like the Stock-to-Flow model, which historically attributed Bitcoin’s price trajectory almost exclusively to supply-side shocks caused by the quadrennial block reward halvings. While the reduction of incoming supply remains a powerful narrative catalyst, the Power Law asserts that Bitcoin’s long-term valuation is actually dictated by demand-side network adoption, which naturally decelerates in growth rate as the addressable global market becomes saturated. As a result, instead of expecting permanent exponential price spikes after every halving event, the Power Law anticipates a smooth, mathematically predictable decay in the rate of capital appreciation, aligning closely with the real-world constraints of liquidity adoption and wealth distribution. This model helps explain why recent market cycles have appeared more extended, with less vertical blow-off tops and more prolonged periods of consolidation around structural fair value. For institutional investors, who are naturally skeptical of models predicting infinite hyperbolic growth, the Power Law’s acknowledgment of diminishing marginal returns offers a highly realistic and intellectually honest framework, positioning Bitcoin not as an anomalous speculative anomaly, but as an asset class bound by the universal mathematics of network maturation.
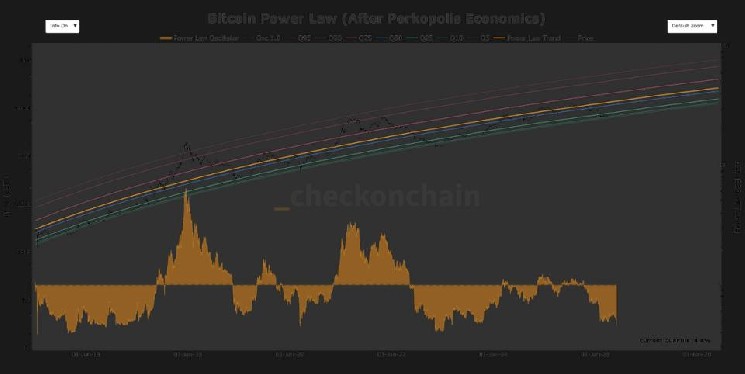
4. Analyzing the Historical Gravitational Pull of the 95.6% Benchmark
Power Law Oscillator (Deviation from Trend)
+————————————————————+
| High Overvaluation (Sell Zone) |
| |
|======================= Fair Value =========================|
| |
| [CURRENT LEVEL] <— Only 4.4% of history has been cheaper |
| Low Undervaluation (Accumulation Zone) |
+————————————————————+
According to highly detailed on-chain data provided by checkonchain, the Power Law Oscillator—a metric designed to measure Bitcoin’s price deviation from its mathematical centerline—reveals that the cryptocurrency is currently trading at a historic discount. The data indicates that when measured against the model’s structural parameters, Bitcoin has been trading at a higher valuation relative to its trend line for approximately 95.6% of its entire trading history. This means that the current price level represents an extreme, multi-standard-deviation discount that has historically occurred during periods of severe market exhaustion, systemic panic, or extreme regulatory uncertainty. Operating at such a deep statistical deviation implies that the speculative premium has been entirely wrung out of the asset, leaving behind nothing but the firm bedrock of spot-driven institutional demand. For entities utilizing algorithmic accumulation strategies and systematic dollar-cost averaging, entering a position when the asset sits in the bottom 4.4% of its historic valuation spectrum represents an asymmetric risk-to-reward ratio that rarely persists for long, as arbitrageurs and deep-value funds historically step in to exploit the market’s temporary inefficiency.
5. Echoes of Black Swans: From the Pandemic Panic to the FTX Collapse
A retrospective look at the few instances when Bitcoin traded at or below these depressed levels reveals a striking pattern: these rare occurrences have always aligned perfectly with defining periods of macro-financial panic and severe industry-wide failures. For instance, the model’s lower boundary was severely tested during the liquidity crisis of March 2020, when the global economy ground to a halt under COVID-19 lockdowns, forcing investors across all asset classes to dump liquid reserves indiscriminately. Similarly, the corridor’s floor held firm in November 2022, when the sudden bankruptcy of the FTX exchange and the subsequent unwind of Alameda Research unleashed unprecedented systemic contagion throughout the crypto shadow-banking sector, sending Bitcoin down to its cyclical low of roughly $15,500. During both historic crises, macro commentators widely declared the Bitcoin thesis permanently broken, yet in each instance, the price bounced sharply off the Power Law’s floor to initiate a strong, multi-year recovery trend. This historical resilience suggests that the lower boundary of the corridor acts as a structural clearing price, a psychological zone where forced liquidations run out of steam and are replaced by highly resilient, long-term capital allocators who understand the asset’s intrinsic value.
6. The Path Forward: Strategic Accumulation and Calculated Risk
While the mathematical elegance of the Power Law corridor provides a compelling framework for analyzing long-term valuation, experienced market participants understand that no predictive model is infallible, transportable, or immune to unexpected external shocks. A prolonged global economic slowdown, aggressive regulatory crackdowns on self-custody, or unexpected structural vulnerabilities within the protocol itself could theoretically force Bitcoin to break below this historically reliable floor. However, within the context of risk management and portfolio construction, the alignment of the Power Law Oscillator with current macroeconomic support levels suggests a highly favorable environment for patient, long-term investors looking to build exposures. As Bitcoin continues to transition from a highly speculative digital novelty to a globally recognized asset held on corporate balance sheets and offered through spot ETFs, its price behavior is expected to align more closely with these natural, network-driven mathematical models. Ultimately, whether this latest drop below $66,000 marks the absolute cyclical bottom or simply another temporary consolidation phase, it highlights the enduring value of mathematical frameworks in navigating the chaotic, sentiment-driven landscape of modern digital assets.


