


Bitcoin Navigates ‘No Man’s Land’ as Market Capsulates Under Critical Psychological Thresholds
The global cryptocurrency market is experiencing a profound moment of hesitation as Bitcoin ($BTC) slips below the foundational $60,000 threshold, casting a shadow of systemic uncertainty across digital asset trading desks worldwide. Now hovering in what seasoned market analysts describe as a financial “no man’s land,” the pioneer cryptocurrency finds itself awkwardly suspended in a structural vacuum, caught between distant on-chain support floors and highly formidable overhead resistance blocks that have proven remarkably difficult to breach. This liminal space is not merely characterized by a temporary lack of trading volume; rather, it reflects a deeper psychological standoff between long-term accumulators who remain hesitant to defend valuations at these levels and short-term speculators who are increasingly squeezed by capital depreciation. Consequently, the inability of the benchmark cryptocurrency to spark a sustained revival past this critical baseline suggests a structural vulnerability in the current market micro-dynamics, signaling to institutional and retail observers alike that the immediate path of least resistance continues to lean heavily toward the downside unless a catalytic demand shock intervenes to realign investor sentiment.
Technical Fractures and the Search for Sustained Crypto Liquidity
This current descent below the $60,000 mark is far from an isolated statistical anomaly; it represents the culmination of successive failures by Bitcoin bulls to retake and consolidate past crucial technical and on-chain milestones over recent weeks. In financial markets, when an asset consistently fails to reclaim its historical pivot points, the resulting negative feedback loop of investor fatigue and algorithmic selloffs tends to accelerate, making recovery an uphill journey fraught with selling pressure at every minor bounce. For blockchain networks, these technical failures are magnified because on-chain ledgers transparently record the exact cost basis of every participant, transforming invisible technical levels into highly tangible battlegrounds of profit, loss, and capitulation. As the digital asset struggles to establish a steady equilibrium within this intermediate zone, the lack of immediate buyers at yesterday’s support levels indicates that liquidity is pooling much lower on the order books, forcing active traders to brace for potential retests of deeper macroeconomic demand zones that have historically cushioned deeper market corrections.
Estimating True Economic Value through the True Mean Price Metric
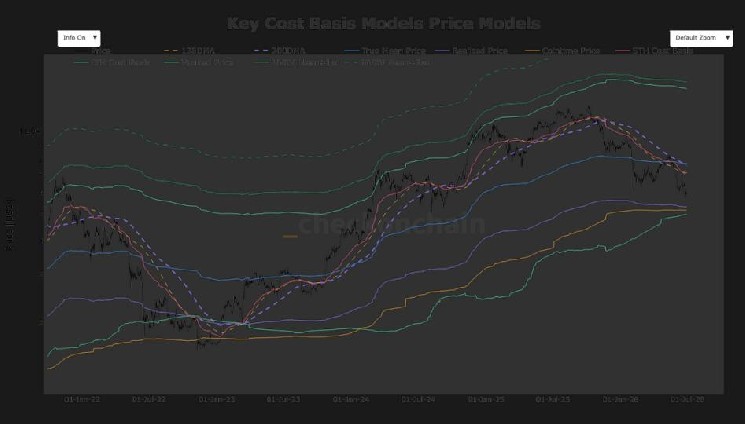
To fully comprehend the gravity of the current market structure, one must look beyond superficial spot prices and examine deep-seated network metrics like the True Mean Price, which currently looms far above market reality at approximately $76,300. This highly sophisticated metric offers an invaluable window into the core health of the Bitcoin ecosystem by estimating the real-world average acquisition cost of all coins in circulation, specifically adjusting the mathematical model for coins that are permanently lost, asleep in legacy wallets, or otherwise inactive for years at a time. By filtering out this “dead” supply, the True Mean Price calculates a much more accurate, dynamically updated economic cost basis for active market participants, revealing that the average active investor is currently underwater relative to the network’s intrinsic cost baseline. When the spot price trades significantly below this true economic mean, it generally indicates a market in a state of cyclical contraction or deep capitulation, historically suggesting that while long-term value is accumulating, the near-term road to recovery remains obstructed by a massive overhead supply of investors eager to break even.
The 200-Day Moving Average as the Line in the Sand for Crypto Bulls
Sitting just beneath that economic fair-value metric is the highly revered 200-Day Moving Average, a technical sentinel currently positioned at $75,500 that Wall Street analysts and algorithmic trading funds look to as the ultimate arbiter of macro trends. Traditionally utilized to bifurcate long-term bullish phases from secular bear markets across all major asset classes, this moving average smooths out daily market noise to expose the underlying trajectory of the asset over a half-year horizon. Bitcoin’s current position well below this 200-day line is a sobering reminder that despite the broader optimism early in the year surrounding spot ETF inflows and macroeconomic easing, the macro trend has shifted into a defensive posture that historically dampens institutional enthusiasm. For exchange-traded fund managers and systemic multi-asset funds, a price below the 200-day moving average triggers risk-mitigation protocols that reduce active exposure, creating a structural headwind where the lack of systematic buying pressure allows short-sellers and spot liquidations to dictate the daily narrative of the market.
The Intermediate Strain: Breaking Down the 128-Day Moving Average
For a clearer picture of the intermediate capital cycles that dictate seasonal market sentiment, analysts closely monitor the 128-Day Moving Average, which is currently acting as a stiff overhead barrier at approximately $70,900. Often viewed as a critical bridge between short-term momentum and long-term macro structures, this intermediate indicator tracks the average velocity of capital accumulation over a roughly four-month cycle—a timeframe that historically aligns with major institutional reallocation windows and post-halving transition phases. The decisive loss of this intermediate trendline over the past month has effectively severed the connection between short-term speculative rallies and sustained institutional trend-following, indicating that the medium-term market momentum has run dry. As long as Bitcoin remains pinned under this $70,900 gateway, any upward price action is widely viewed by institutional trading desks as mere counter-trend relief rallies rather than the initiation of a new, sustainable leg upward, keeping swing traders highly cautious and heavily hedged in cash or stablecoin reserves.
Short-Term Holder Pain and the Looming Threat of Capitulation
Perhaps the most immediate, psychologically-charged obstacle facing the market is the Short-Term Holder Cost Basis, which now represents a massive cluster of resistance at $69,600 and measures the average purchase price of investors who have acquired their coins within the last 155 days. Unlike battle-tested, long-term believers who possess a multi-year horizon and are comfortable weathering multi-month drawdowns, these short-term market entrants are notoriously sensitive to price fluctuations, and their average entry point serves as a critical demographic boundary of psychological comfort or existential panic. Because these recent buyers are collectively in a state of unrealized loss as Bitcoin languishes under $60,000, their tendency to sell into any market recovery in an attempt to salvage their capital creates a formidable ceiling of selling pressure, colloquially referred to as “overhead supply congestion.” Ultimately, until Bitcoin can orchestrate a comprehensive structural turnaround that systematically reclaims these tiers—led by the short-term holder baseline at $69,600, the intermediate 128-day at $70,900, and the institutional 200-day at $75,500—the digital asset remains trapped in a defensive grind where patience, risk management, and macro resilience will define the survival of market participants.


