





67 Million and Counting: New Interactive Map Reveals the True Face of American Crypto Ownership
The United States has long been defined by its geographical, economic, and cultural diversity, and now that same spirit of decentralized abundance is redefining the national landscape. This week, the National Cryptocurrency Association (NCA) unveiled a groundbreaking interactive tool that visualizes the estimated locations of 67 million American cryptocurrency holders. It is a digital cartography that charts not just coins and tokens, but the changing demographics of a financial revolution. The map, which provides state-by-state and congressional district-level data, paints a vivid picture of how far digital assets have penetrated the mainstream—and how political representation, economic output, and job creation are now inextricably linked to the blockchain.
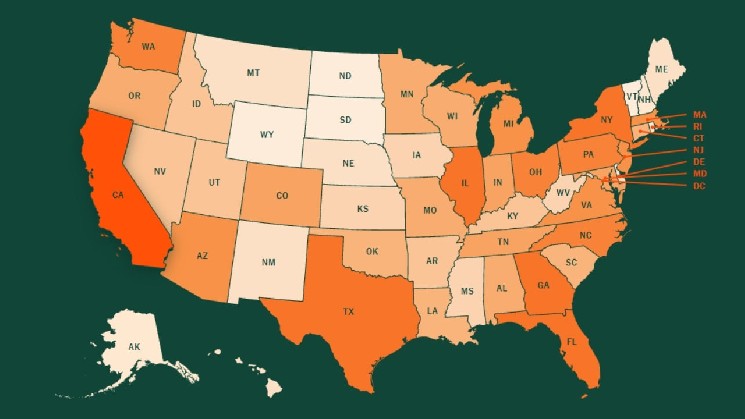
Ripple Chief Legal Officer and NCA President Stuart Alderoty unveiled the resource on X, noting, “67 million Americans hold crypto. 232,000 American jobs are supported by the industry.” The map is designed to give citizens and lawmakers alike a granular view of an asset class that has moved from the fringes of the internet to the heart of the American economy. From the sunny shores of California to the industrial heartland, the interactive hub for the 119th Congress offers a state and district view, allowing a user to click on any region and see its estimated crypto-owning population. It is a data-driven revelation that suggests cryptocurrency is not a niche subculture, but a permanent pillar of the modern American financial ecosystem.
A Nation of Digital Holders: Breaking Down the State-by-State Numbers
The distribution of ownership is as vast as the country itself, but the data reveals distinct regional hotspots. Not surprisingly, the most populous states dominate the top of the list. California leads the nation with a staggering 9.5 million estimated crypto holders, a figure that exceeds the population of many states. Following closely behind are Texas with 5.94 million, Florida with 4.71 million, New York with 4.66 million, and Illinois rounding out the top five with 2.64 million. These figures, drawn from the “2026 State of Crypto Holders Report,” suggest that roughly one in four American adults now owns a form of digital currency. While population density plays a significant role, the regional breakdowns tell a more nuanced story of economic adaptation.
When examining the data geographically, the South emerges as the unmitigated leader, accounting for 38% of all national holders. This is followed by the West at 27%, with the Midwest and Northeast each claiming an 18% share. The fact that the Midwest and Northeast are tied is particularly telling, as it indicates that crypto adoption is not solely confined to the tech hubs of Silicon Valley or the financial corridors of Wall Street. Instead, the ownership is diffusing across the Rust Belt and the Great Plains, suggesting that everyday families from Chicago to Kansas City are seeking the financial sovereignty that digital assets provide. This geographic spread underscores a critical point: crypto has transcended its early-adopter phase and is now a mainstream financial tool for a wide swath of the country.
The Methodology Behind the Map: How a Poll Becomes a Portrait
While the visualization is simple to navigate, the statistical heavy lifting behind it is anything but. The NCA’s map is not a census but a sophisticated statistical estimation, blending demographic modeling with survey data to estimate the number of holders in each district. “The figures represent a modeled estimate, not a verified count of citizens who have raised their hands,” the association noted. The model relied on a sample of 10,000 U.S. crypto holders to establish national demographic profiles, which were then married with district-level signals. The result is a “posterior mean”—the model’s central estimate—and a 95% credible interval, which provides a range for where the true number likely falls.
The underlying data itself originates from a nationwide survey conducted by The Harris Poll for NCA between February 12 and March 3. Researchers weighted the survey results to ensure they were representative of the broader American public, a process that allows a sample of tens of thousands to extrapolate to a population of hundreds of millions. The margin of error for the overall holdings figure is a razor-thin 0.7 percentage points. To put this in perspective, a separate July study that focused specifically on Bitcoin estimated that 49.6 million Americans hold that leading digital asset, representing 18.6% of the adult population. The NCA figure is larger because it encompasses all cryptocurrencies, but the closeness of the numbers reveals the sheer dominance of Bitcoin within the broader digital asset space.
More Than Just HODLing: The Economic Engine of Crypto Employment
Beyond the holders themselves, the NCA’s new data provides a stark look at the industry’s massive economic footprint. The maps are accompanied by an analysis from the Pragmatic Policy Group, which found that the crypto industry supports 231,845 jobs across the United States. This is not a monolithic “crypto bro” phenomenon; it represents $55.4 billion in economic output and $30.8 billion in worker income. The employment ecosystem is multifaceted: the data breaks down into roughly 34,000 direct positions at crypto-native companies, 75,000 indirect jobs at suppliers such as equipment manufacturers and legal services, and a staggering 123,000 “induced” jobs created by the spending power of those workers in sectors like health care, suburban real estate, and hospitality.
Just as it leads in ownership, California also dominates the employment landscape, supporting nearly 57,600 crypto jobs and generating over $16.9 billion in economic impact. However, the story extends far beyond the West Coast. New York accounts for 53,800 jobs, while Texas supports 26,500. Surprisingly, smaller states are punching above their weight; Washington State contributes 15,100 jobs, and North Carolina is close behind at roughly 9,500. For each direct crypto position, there are roughly six other roles supported, from the coffee shops in Los Angeles where developers buy their morning fuel, to the logistics and energy sectors in the Midwest. The cryptocurrency industry, once viewed with skepticism by traditional financiers, has evolved into a sophisticated job creator with a nationwide reach.
The Human Element: Bridging Education, Policy, and the Road Ahead
Behind the interactive maps and statistical models lies the NCA’s core mission, which is fundamentally about education and awareness. The organization, which launched in March 2025 with a $50 million grant from Ripple, was founded to fill a void in the public consciousness about digital assets. Rather than talking down to people or relying on overly technical jargon, the NCA aims to provide “facts, resources, tools, and support,” according to Alderoty. By clearing up the confusion around cryptocurrency, they make it possible for everyday Americans to make informed financial decisions and for lawmakers to write effective, balanced legislation. The release of the interactive map is a natural extension of this mission, serving as both a mirror and a window into the digital economy.
The implications of this data extend far beyond mere curiosity. For policymakers in Washington, D.C., the map demonstrates that crypto is a voting and economic issue across the political spectrum. For the 119th Congress, it offers a clear geographic mandate to address regulatory clarity. For investors, it highlights market saturation and growth potential in unexpected places. As the NCA continues to track these numbers, one thing is certain: the days of crypto being an obscure subculture are over. With 67 million residents now participating in the digital asset economy, the question is no longer if crypto will succeed in the U.S., but how well the nation will harness its potential for jobs, investment, and the future of finance.