



The Return of the Onchain Giants: How Bitcoin’s Resurgent Transaction Volume is Rewriting the Network’s Ledger
A Historic Resurgence Across the Blockchain
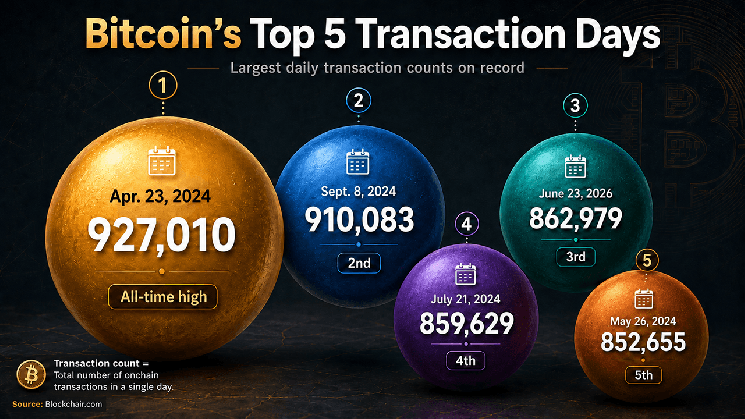
The global cryptocurrency landscape is witnessing a massive migration back to first-principles network activity, marked by a stunning resurgence in Bitcoin onchain transactions. According to the latest multi-year statistics from blockchain analytics platform Blockchair, the Bitcoin network registered an astonishing 862,979 settled transactions on June 23, 2026. This metric represents the single most active day the network has experienced in nearly two years, trailing only two legendary sessions from the historic 2024 bull run: the all-time high of 927,010 transactions recorded on April 23, 2024, and the second-place print of 910,083 transactions set on September 8 of the same year. For context, not a single operating day throughout the entirety of 2025 came within striking distance of this volume, making the June 23 spike the clearest signal yet that Bitcoin’s base layer is entering an era of unprecedented utility and liquidity migration.
Deciphering the Mechanics of Onchain Momentum
Historic Bitcoin Transaction Rankings (All-Time)
┌───────────────────┬──────────────────────────┬────────────────────────┐
│ Rank / Date │ Daily Transaction Count │ Historical Context │
├───────────────────┼──────────────────────────┼────────────────────────┤
│ 1. April 23, 2024 │ 927,010 tx │ All-Time High Record │
│ 2. Sept. 8, 2024 │ 910,083 tx │ Post-Halving Spike │
│ 3. June 23, 2026 │ 862,979 tx │ Current Cycle Peak │
│ 4. July 21, 2024 │ 859,629 tx │ Summer Consolidation │
│ 5. May 26, 2024 │ 852,655 tx │ Peak Run-up Session │
└───────────────────┴──────────────────────────┴────────────────────────┘
To understand the weight of this record-breaking day, market analysts must look beyond the immediate speculative asset prices broadcasted across retail crypto exchanges. A high transaction count reflects a fundamental reality: more unique digital wallets are actively moving physical capital across the decentralized base-layer ledger. This surge in network throughput points toward a mix of institutional exchange settlements, massive whale movements, large-scale miner distributions, and a broader, less speculative revival of consumer and corporate trust in the network’s settlement speed. By securing the third-highest daily transaction volume in the history of decentralized finance, the summer of 2026 has officially pushed July 21, 2024 (859,629 transactions) and May 26, 2024 (852,655 transactions) down to fourth and fifth places, respectively. This shifting of the guard proves that Bitcoin’s primary value proposition as an institutional-grade settlement engine is stronger than ever.
The Anatomy of a Month-by-Month Rebound
Bitcoin’s Steady Onchain Ascent (First Half of 2026)
Average Daily Transactions (Jan – Jun)
650k ─────────────────────────────────────────────── June: 651.6k
600k ──────────────────────────────────── May: 645.3k
550k ───────────────────────── Apr: 560.2k
500k ─────────────── Mar: 475.0k
450k ── Feb: 468.6k
400k ── Jan: 390.8k
Far from being a temporary statistical anomaly or the result of a single-day network exploit, the milestone on June 23 was the product of a steady, month-by-month structural ascent. Examining individual periods throughout the first half of 2026 reveals a deeply consistent growth trajectory. In January, the network began its climb with a daily average of 390,877 transactions and a median of 383,148. By February, that average jumped to 468,602, keeping pace through March at 475,075. The spring months catalyzed a massive breakout, with April averaging 560,212 transactions, followed by a dramatic leap in May to 645,363, and culminating in June’s robust average of 651,655 daily settlements. From the cold start of January to the heat of June, the monthly transaction average surged by 66.7%, while the median grew by 64.2%. This kind of uniform, sustained escalation across an entire half-year period signals a systematic rise in organic, base-layer network utility, rather than a brief speculative rush.
Dissecting the Great Crypto Winter of 2025
This powerful 2026 comeback stands in stark contrast to the quiet consolidation that defined the cryptocurrency markets during 2025. Over the course of those twelve months, Bitcoin’s onchain engine experienced a clear and noticeable cooling period. The median daily transaction count slipped to 417,151 in 2025—a painful 18% decline from 2024’s median of 508,934. The annual average tellingly followed suit, dropping nearly 20% to settle at 421,184. In total, the net settlement volume for 2025 wound up at 153.7 million transactions, which sat nearly 38.5 million behind the record totals established in 2024. During this quiet period, the network failed to produce a single day exceeding 700,000 transactions, whereas 2024 had recorded those high-volume sessions 51 times. Additionally, the network saw transactional activity dip below the 400,000-mark on 150 separate days in 2025, painting the picture of a network undergoing a necessary, yet undeniable, period of quiet dormancy.
Onchain Network Density Comparison (YTD Through July 5)
┌──────────────────────────────────────┬──────────────────┬──────────────────┐
│ Network Metric │ YTD 2025 │ YTD 2026 │
├──────────────────────────────────────┼──────────────────┼──────────────────┤
│ Daily Average Settlement Volume │ ~385k tx/day │ 533,890 tx/day │
│ Year-to-Date Median Value │ ~374k tx/day │ 529,623 tx/day │
│ Days Tracking at or Above 600,000 tx │ 5 days (Full Yr) │ 59 days (YTD) │
└──────────────────────────────────────┴──────────────────┴──────────────────┘
Year-Over-Year Dynamics and Mid-Year Checkpoints
June Transaction Comparison (2025 vs. 2026)
2025: 342,866 daily avg.
2026: 651,655 daily avg. (+90.1% YoY Increase)
================──────────────────────────────────────────────────────
The year-over-year data highlights the sheer velocity of this ongoing network expansion. When comparing June 2025 to June 2026, the metrics reveal a near-doubling of network throughput. June 2025 saw a modest average of 342,866 transactions per day; fast forward one year, and June 2026 posted a massive 651,655 transaction average—representing a year-over-year jump of 90.1%. Looking at the first half of the year as a whole, the 2026 year-to-date average sits an impressive 38.5% ahead of 2025’s pace, while the running median has surged 41.6% higher. Comparing identical, parallel windows across both calendar years removes any seasonal distortions, confirming that the current run of activity is built on authentic adoption, broader wallet creation, and deeper institutional integration.
Navigating the Road Ahead for Bitcoin’s Ledger
As the market heads into the second half of 2026, onchain analysts are carefully weighing these metrics against the occasional sharp market correction. A stark reminder of this volatility occurred on July 5, 2026, when daily transactions fell to 367,365 from the previous day’s high of 766,307. This drop of nearly 400,000 transactions represents the largest single-day settlement decline ever recorded. Yet, even with this historic drop, the larger trend remains firmly intact. The five-day moving average for early July holds strong at 595,193 transactions, which is heavily backed by 2026’s monumental tally of 59 days at or above the 600,000-transaction threshold. Back in 2025, that level was reached on only five days all year. While the premium daily record of 927,010 transactions still belongs to 2024’s bull market, the steady path of sustainable, everyday transaction volume belongs entirely to 2026. This signals a new era of decentralized network design, utility, and financial maturity.