




Bitcoin Price Analysis: BTC Surges Past $75K as Bulls Seize Control of the Market
Cryptocurrency Markets Rally as Bitcoin Breaks Critical Resistance Levels
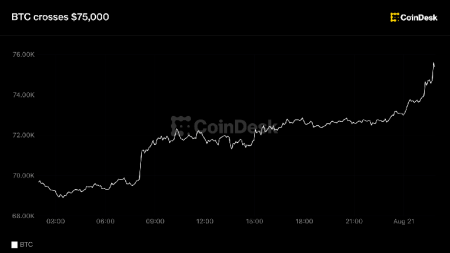
The cryptocurrency market is witnessing a significant moment today as Bitcoin, the world’s largest digital asset by market capitalization, has surged past the $75,000 threshold, marking a decisive shift in market sentiment. This remarkable price movement represents more than just another milestone in Bitcoin’s volatile journey—it signals a potential end to the prolonged bearish pressure that has characterized much of the past year. As traders and investors alike scramble to interpret these developments, the data suggests that we may be witnessing the early stages of a more substantial bullish trend that could have far-reaching implications for the entire cryptocurrency ecosystem.
Breaking Down Bitcoin’s Impressive Price Surge and Market Dynamics
The numbers tell a compelling story of renewed investor confidence and market momentum. Over the past 24 hours, Bitcoin has demonstrated remarkable strength, trading between a low of $69,320 and reaching an impressive high of $75,527. This represents a substantial intraday range that underscores the intense buying pressure currently gripping the market. At the time of writing, Bitcoin trades at $75,225, showing an extraordinary 8.3% increase in value—a move that has caught the attention of both retail and institutional investors worldwide.
Perhaps most significantly for technical analysts and market observers, Bitcoin has successfully broken above its nine-month downtrend, a development that many had been patiently awaiting. This breakout is particularly meaningful because it represents not just a short-term price bounce, but a potential structural shift in market dynamics. The ability to overcome this long-standing resistance level suggests that the accumulation phase may finally be complete and that we could be entering a new phase of price discovery.
The trading volume accompanying this move has been nothing short of impressive, with 24-hour trading volumes reaching $60.27 billion. This substantial volume validates the price movement and indicates genuine market participation rather than a low-volume move that could be easily reversed. High volume breakouts are typically viewed more favorably by technical analysts, as they suggest broader market consensus and commitment to the new price levels.
Key Support and Resistance Levels: What the Data Reveals
Looking beneath the surface of this price action, the on-chain and order book data provides crucial insights into where Bitcoin might find support or face resistance in the coming days and weeks. Perhaps one of the most encouraging signs for bulls is the identification of a substantial support zone between $61,849 and $63,111. This range is significant because more than 2 million BTC previously changed hands within these price levels, creating what analysts refer to as a “volume shelf” that could act as strong support during any potential pullbacks.
The concentration of volume at these levels suggests that many market participants have established positions within this range, creating a psychological and technical foundation that could help limit downside risk. For traders and investors, this information is invaluable, as it provides a clear reference point for potential entry positions or stop-loss levels. The presence of such a robust support zone adds a layer of confidence to the current bullish thesis, even as the market experiences natural volatility and occasional corrections.
Looking to the upside, the URPD (Unspent Realized Price Distribution) data reveals limited resistance above current prices, which is typically a bullish signal. Should Bitcoin manage to decisively clear the $75,733 level, the path appears relatively open toward the next significant supply zone, which sits between $83,307 and $84,569. This range is notable because approximately 1 million BTC previously changed hands at these levels, potentially creating selling pressure from holders looking to exit positions at a profit.
Technical Indicators Painting a Bullish Picture
The technical analysis landscape for Bitcoin is currently dominated by overwhelmingly bullish signals, with momentum indicators confirming the strength of the current move. The Moving Average Convergence Divergence (MACD) indicator, a widely-followed momentum oscillator, is displaying a configuration that technical analysts view as strongly positive. The MACD line sits comfortably above the signal line, and perhaps more tellingly, the histogram bars—which represent the distance between these two lines—have reached unusually tall levels.
This configuration suggests that buying pressure is not just present but rapidly accelerating, indicating that the current momentum behind Bitcoin’s price movement is exceptionally strong. When the MACD histogram expands to such significant levels, it typically indicates that the prevailing trend has substantial force behind it, though traders often watch for potential exhaustion signals when the histogram begins to contract from such extreme readings.
Adding to the bullish technical picture, both the MACD line and signal line are positioned above the zero line, which is generally interpreted as a confirmation that the overall trend is bullish. This alignment reinforces the notion that we are in an uptrend, with the momentum clearly favoring buyers over sellers in the current market environment.
RSI Signals and the Risk of Short-Term Pullbacks
However, experienced traders and market analysts are quick to point out a potential concern that accompanies such strong momentum. Bitcoin’s daily Relative Strength Index (RSI) has climbed to an extraordinary 93, placing it firmly in what is considered deeply overbought territory. The RSI is a momentum oscillator that measures the speed and magnitude of recent price changes, with readings above 70 typically indicating overbought conditions and readings below 30 indicating oversold conditions.
An RSI reading of 93 is remarkable by nearly any standard, and it represents one of the most extreme overbought readings we’ve seen in Bitcoin’s trading history. This level suggests that the buying pressure has been so intense and sustained that the market may have temporarily exhausted its upward momentum. Historically, when the RSI reaches such extreme levels, it often precedes a period of consolidation or a modest correction as the market takes time to “digest” the rapid price appreciation and allow technical indicators to reset to more sustainable levels.
This doesn’t necessarily mean that the broader uptrend is at risk—rather, it suggests that the market may need to take a breather before continuing its upward trajectory. The path of least resistance could involve a period of sideways trading or a modest pullback that allows the RSI to cool off and find more sustainable momentum levels. For traders, this potential short-term exhaustion point represents both a risk and an opportunity, as it could provide better entry points for those looking to position themselves for the next leg of the move.
Market Structure and the Case for Continued Bullishness
The current market structure supports the view that we may simply be witnessing the early stages of a more substantial rally. The successful breach of the nine-month downtrend is a significant technical achievement that opens up the possibility of further upside. When such long-standing resistance levels are broken with conviction and strong volume, it often signals a fundamental shift in market dynamics that can persist for extended periods.
Traders will be closely monitoring how Bitcoin behaves around the current resistance levels, particularly the $75,733 mark. A decisive break and hold above this level could trigger additional buying momentum, potentially leading to a swift move toward the $83,000-$84,500 supply zone. Alternatively, if Bitcoin struggles to maintain its gains and begins to retreat, the substantial support zone between $61,849 and $63,111 could serve as a strong backstop, limiting downside potential.
For the broader cryptocurrency market, Bitcoin’s performance remains the primary driver of sentiment. A sustained rally in Bitcoin typically has a halo effect on altcoins and the broader digital asset ecosystem, attracting capital and attention to the space. Conversely, any significant correction could dampen enthusiasm across the board. As such, the upcoming days and weeks will be crucial in determining whether this breakout represents the beginning of a new bull phase or whether it’s merely a temporary reprieve within a larger bearish structure.
Weighing Risks and Potential Rewards in a Momentum-Driven Market
As the cryptocurrency community digests these dramatic price developments, the prevailing sentiment is cautiously optimistic, with many analysts highlighting both the significant opportunities and the inherent risks associated with such volatile markets. The extreme RSI reading serves as a reminder that markets rarely move in straight lines, and even the strongest trends experience periods of consolidation or retracement.
For investors with a longer time horizon, the current technical setup presents an interesting proposition. The combination of a confirmed breakout above long-term resistance, strong volume behind the move, and relatively limited overhead supply suggests that the risk-reward ratio could still favor the upside, even after this substantial rally. The $61,849-$63,111 support zone provides a clear reference point for risk management, offering guidance on where the current thesis might be invalidated.
Short-term traders, on the other hand, may want to exercise caution given the extreme overbought conditions. While momentum strategies have been highly profitable during this move, chasing prices at these elevated levels carries significant risk of entering positions just before a natural correction or consolidation phase. Waiting for the technical indicators to reset or for a pullback to support levels could provide more favorable entry points.
Regardless of the short-term direction, the significance of today’s price action should not be underestimated. Bitcoin breaking above its nine-month downtrend and reclaiming the $75,000 level represents a meaningful shift in market psychology that could have lasting implications for the cryptocurrency market. As the world’s largest digital asset continues to mature and attract institutional interest, the ability to sustain these gains and build upon this momentum will likely determine the market’s trajectory for the coming months.