


Ethereum’s price action this week has been a story of a promising surge followed by a hesitant retreat, leaving its near-term trajectory uncertain. The cryptocurrency briefly broke above a key resistance zone, offering a glimmer of hope to bullish investors, but failed to maintain the momentum necessary for a confirmed breakout. This “false breakout” scenario introduces the possibility of a reversal and a subsequent descent to lower price levels, especially if selling pressure intensifies.
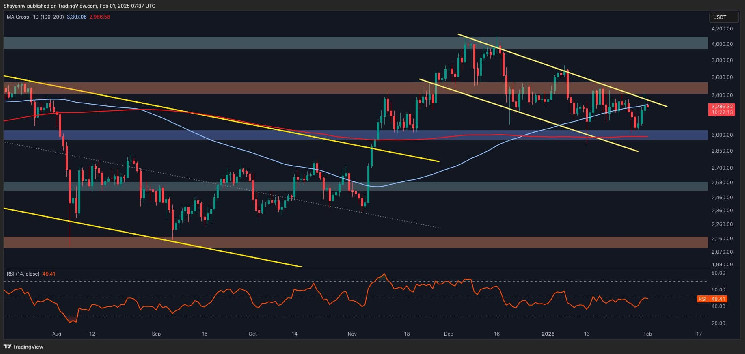
The core of the resistance faced by Ethereum lies in a confluence of technical indicators. The 100-day moving average currently sits around $3,300, acting as a dynamic resistance level. Furthermore, the upper boundary of a bullish flag pattern, a technical formation suggesting a potential continuation of an uptrend, is located near $3,400. Ethereum managed to surpass both of these levels, reaching a high near $3,500. However, the substantial selling pressure encountered at this juncture exposed a lack of sufficient buying power to sustain the upward movement. This inability to hold above $3,500 ultimately led to the characterization of the initial surge as a false breakout, raising concerns about a potential rejection and a subsequent downward correction.
Analyzing the situation from a shorter-term perspective using a 4-hour chart provides additional insights. Ethereum gained momentum after bouncing off the 0.5-0.618 Fibonacci retracement zone, a common area of support in technical analysis. This resurgence allowed the cryptocurrency to break above a descending wedge pattern, a bullish signal often interpreted as a potential resumption of an uptrend. However, the familiar $3,500 resistance level once again proved to be a formidable barrier, triggering a retracement back towards the previously broken trendline of the wedge. The subsequent price action will be critical in determining Ethereum’s near-term direction. If the cryptocurrency finds support at the trendline and completes a healthy pullback, the bullish structure could remain intact, setting the stage for another attempt to conquer the $3,500 resistance. Conversely, a failure to attract buyers at this level could lead to a deeper correction, potentially revisiting the $3,000 support level.
On-chain analysis offers another layer of understanding, particularly concerning potential market movements around key price levels. The Binance liquidation heatmap, which tracks areas where large numbers of leveraged positions are likely to be liquidated, reveals a significant cluster of short-position liquidations just above the $3,500 resistance. This accumulation of short positions presents a tempting target for bullish traders and institutional investors, as a breakout above $3,500 could trigger a cascade of short liquidations, further propelling the price upward. Liquidity tends to act as a magnet for price action, and the presence of these short liquidations just above the key resistance level increases the likelihood of a breakout in the mid-term.
The confluence of technical and on-chain factors paints a complex picture for Ethereum’s price outlook. While the false breakout and subsequent retracement raise concerns about a potential downward correction, the presence of significant short liquidations above $3,500 offers a bullish counterpoint. The $3,500 level remains a critical battleground, and a decisive move above this resistance, fueled by short liquidations, could ignite a substantial rally, potentially driving Ethereum towards the psychologically significant $4,000 mark.
In essence, Ethereum stands at a crossroads. The recent price action highlights the struggle between bulls and bears, with the $3,500 level serving as the primary battleground. A successful breach of this resistance, supported by strong buying volume and triggered short liquidations, could unlock significant upside potential. However, a failure to overcome this hurdle could lead to a renewed downturn, potentially revisiting lower support levels. The coming days and weeks will be crucial in determining which scenario ultimately unfolds, and traders will be closely monitoring the price action for confirmation of either a bullish breakout or a bearish reversal.


