


Bitcoin Breaks Key Resistance as Inflation Data Fuels Rally Toward $120,000
Bullish Technical Pattern Confirmed as BTC Surges Past $113,600
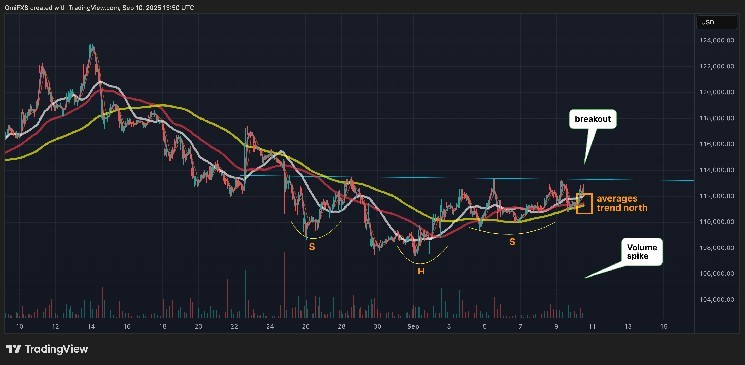
In a significant market development that caught the attention of cryptocurrency investors worldwide, Bitcoin surged past the $113,600 threshold following the release of softer-than-expected U.S. Producer Price Index (PPI) data. This upward movement has confirmed the bullish inverse head and shoulders pattern that market analysts had been closely monitoring throughout the week, signaling renewed strength in the world’s leading cryptocurrency.
The breakout represents a pivotal moment for Bitcoin, effectively marking the conclusion of the recent pullback from its all-time highs above $124,000 and heralding the resumption of the broader bullish trend that has characterized much of 2023. According to detailed technical analysis utilizing the measured move technique—a method that projects potential price targets by adding the distance between a pattern’s low point and the breakout level to the breakout itself—Bitcoin could be poised to reach approximately $120,000 in the near term. This projection has sparked considerable optimism among investors who had been concerned about the sustainability of Bitcoin’s recent price action following its retreat from record territory.
Technical indicators across multiple timeframes are aligning to support this bullish outlook, providing a comprehensive framework for understanding the current market dynamics. The ascending 50-, 100-, and 200-hour simple moving averages (SMAs) collectively indicate strengthening momentum that suggests buyers are firmly in control of the market’s direction. Perhaps more significantly, the daily chart’s Moving Average Convergence Divergence (MACD) histogram has crossed above zero—a development that technical analysts interpret as confirmation of a positive shift in market sentiment and potentially the beginning of a new upward phase in Bitcoin’s price action. The convergence of these technical signals across different timeframes has reinforced confidence among traders who rely on chart patterns to inform their investment decisions.
Looking ahead, market participants are carefully monitoring key resistance and support levels that could influence Bitcoin’s price trajectory in the coming days. On the upside, the cryptocurrency may encounter meaningful resistance near the closely watched 50-day simple moving average, currently positioned at approximately $114,700. This level represents a potential obstacle that bulls will need to overcome to validate the continuation of the upward movement toward the projected $120,000 target. Conversely, the recently established higher low around $110,000 serves as a critical support level that bears would need to breach to challenge the bullish narrative. The establishment of this higher low—a pattern consistent with uptrends—further reinforces the positive technical structure that has developed following the confirmation of the inverse head and shoulders pattern.
The relationship between macroeconomic data and Bitcoin’s price action has been particularly noteworthy in this instance, with the softer PPI figures providing the catalyst for the breakout. This correlation highlights Bitcoin’s evolving role in the broader financial ecosystem, as investors increasingly view the cryptocurrency through the lens of traditional asset classes that respond to economic indicators and monetary policy expectations. The PPI data, which suggested moderating inflation pressures, potentially reduces the likelihood of aggressive monetary tightening by the Federal Reserve—a scenario that has historically benefited risk assets like Bitcoin. This interplay between economic fundamentals and technical analysis demonstrates the multifaceted nature of cryptocurrency markets, where traditional financial factors increasingly influence digital asset valuations.
The current technical setup for Bitcoin reflects a significant shift from the market conditions observed during the recent pullback, with multiple indicators now pointing toward renewed bullish momentum. The confirmation of the inverse head and shoulders pattern—a formation that typically signals a reversal from bearish to bullish conditions—provides a structured framework for understanding the potential magnitude of the upcoming price movement. With the MACD histogram turning positive and the hierarchy of moving averages displaying a bullish alignment, the technical landscape appears increasingly favorable for Bitcoin. Market analysts emphasize that the combination of these factors, coupled with the psychological significance of breaking above the $113,600 level, creates a compelling case for continued upward momentum in the near term, potentially challenging the resistance at the 50-day SMA before targeting the projected level near $120,000.
As Bitcoin navigates this crucial technical juncture, investors and traders alike are recalibrating their strategies to account for the changing market dynamics. The confirmation of the bullish pattern and the positive shift in momentum indicators suggest that the recent pullback may have been a temporary interruption rather than a reversal of the broader uptrend. With technical analysis providing a roadmap for potential price targets and key levels to monitor, market participants now have a clearer framework for assessing Bitcoin’s prospects in the coming weeks. Whether the cryptocurrency can successfully reach the projected $120,000 level will depend on its ability to maintain momentum above current levels and overcome resistance at the 50-day SMA—developments that will be closely watched by investors seeking to capitalize on Bitcoin’s continued evolution as both a technological innovation and a maturing financial asset.


")


