


Bitcoin Mining Disruption: What the Hash Ribbon Indicator Signals for Crypto’s Next Move
Weekend Storm Impacts Bitcoin Network as Traders Eye Critical Technical Indicator
The severe weather system that swept across the United States this weekend has done more than just disrupt daily life—it’s significantly impacted the Bitcoin mining industry, forcing operators to reduce their computational contributions to the network as profitability concerns mounted. As mining operations scaled back in response to rising operational costs, cryptocurrency traders and analysts have turned their attention to a technical indicator known as the Hash Ribbon—a metric that has historically signaled important market turning points during periods of miner capitulation.
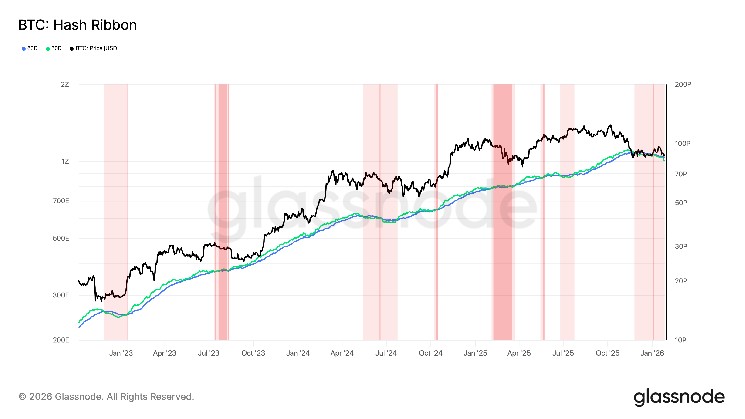
The Hash Ribbon indicator, which tracks the relationship between the 30-day and 60-day moving averages of Bitcoin’s hashrate, has repeatedly demonstrated its value as a predictive tool for identifying potential price bottoms. During times when economic pressures force miners to reduce operations—a phenomenon known as “miner capitulation”—Bitcoin has frequently established significant price floors before beginning new upward trajectories once network conditions stabilize. This pattern has occurred consistently enough to warrant serious consideration from market participants looking for strategic entry points in the volatile cryptocurrency market.
Understanding Miner Capitulation and Its Market Impact
Miner capitulation represents a crucial phase in Bitcoin’s market cycle, occurring when mining operations become economically unsustainable for a significant portion of network participants. When operational costs exceed mining rewards, smaller or less efficient miners often have no choice but to power down their equipment, reducing the network’s overall computational power—or hashrate. The Hash Ribbon indicator visualizes this process on Glassnode’s analytics platform, where capitulation is signaled when the 30-day moving average of hashrate drops below the 60-day moving average, displayed as a light red zone on charts.
The recovery phase begins when the short-term average crosses back above the longer-term average, indicated by a transition to darker red on the indicator. Market analysts pay particularly close attention when this hashrate recovery coincides with a shift in price momentum from negative to positive—a transition marked on the Hash Ribbon by a color change from dark red to white. Historically, this confluence of factors has identified some of Bitcoin’s most favorable long-term accumulation opportunities, providing investors with a data-driven framework for timing market entries during periods of apparent distress.
Current Network Metrics Reveal Significant Mining Disruption
The recent weather events have precipitated a dramatic decline in Bitcoin’s network hashrate, which has fallen approximately 20% from its recent high of around 1.2 zettahash per second (ZH/s) to approximately 950 exahashes per second (EH/s). This substantial reduction in computational power will likely trigger one of Bitcoin’s built-in self-regulation mechanisms—a downward difficulty adjustment estimated at approximately 17%. If this projection holds, it would represent the most significant difficulty reduction since July 2021, when China’s sweeping ban on cryptocurrency mining forced a massive migration of mining operations and temporarily crippled network capacity.
Bitcoin’s protocol adjusts mining difficulty approximately every two weeks to maintain consistent 10-minute block times, regardless of how much computing power is active on the network. These adjustments ensure the blockchain’s continued functionality even during periods of extreme hashrate volatility. For miners who maintain operations through the capitulation phase, difficulty reductions typically translate to increased profitability once conditions normalize, as their proportional share of mining rewards grows relative to the reduced competition.
Historical Precedents: What Past Hash Ribbon Signals Have Predicted
The Hash Ribbon’s most recent capitulation signal appeared in late November, coinciding with Bitcoin forming a temporary price floor around $80,000 before recovering to its current level of approximately $88,000. This pattern aligns with previous instances where miner capitulation has preceded meaningful price recoveries. In mid-2024, following a Hash Ribbon capitulation event that coincided with unwinding pressures in the yen carry trade, Bitcoin established a bottom near $49,000 in August before embarking on an impressive rally that eventually reached $100,000 by January of the following year.
Perhaps even more striking was the indicator’s performance during the market crisis triggered by FTX’s collapse in 2022. As institutional failures sent shockwaves through the cryptocurrency ecosystem, Bitcoin’s price plummeted to approximately $15,000 amid widespread miner capitulation. However, once the Hash Ribbon normalized—signaling that the most severe phase of mining distress had passed—the price staged a significant recovery, eventually stabilizing around $22,000 and establishing the foundation for the subsequent bull market that would unfold in the years that followed.
Market Implications and Future Outlook as Network Adapts
The central question now confronting Bitcoin market participants is whether this established pattern will repeat itself, potentially signaling that the current disruption represents a temporary setback rather than the beginning of a more prolonged downturn. As miners adapt to changing conditions and hashrate metrics eventually stabilize, many analysts will be watching for the characteristic Hash Ribbon recovery signal—the crossing of the 30-day moving average back above the 60-day moving average—particularly if it coincides with improving price momentum.
The relationship between mining economics and Bitcoin price action highlights the unique interdependency that exists between the cryptocurrency’s security infrastructure and its market valuation. Unlike traditional financial assets, Bitcoin’s underlying network health directly influences market psychology, creating feedback loops that can amplify both positive and negative price movements. For investors and traders looking beyond day-to-day volatility, these deeper structural indicators like the Hash Ribbon offer contextual understanding that can prove invaluable when navigating market cycles. As the network adapts to the current disruption and miners recalibrate their operations, the coming weeks may provide critical insights into Bitcoin’s next major market phase—potentially setting the stage for another expansionary period if historical patterns hold true.


